Bitcoin cycle dashboard: where are we in the cycle?
Is Bitcoin currently cheap or overheated – and which phase of the cycle are we in? The cycle dashboard in CryptoCompass combines eight proven metrics into a market temperature from 0 to 100, shows it in comparison with the four previous cycles and explains every figure in one plain sentence.
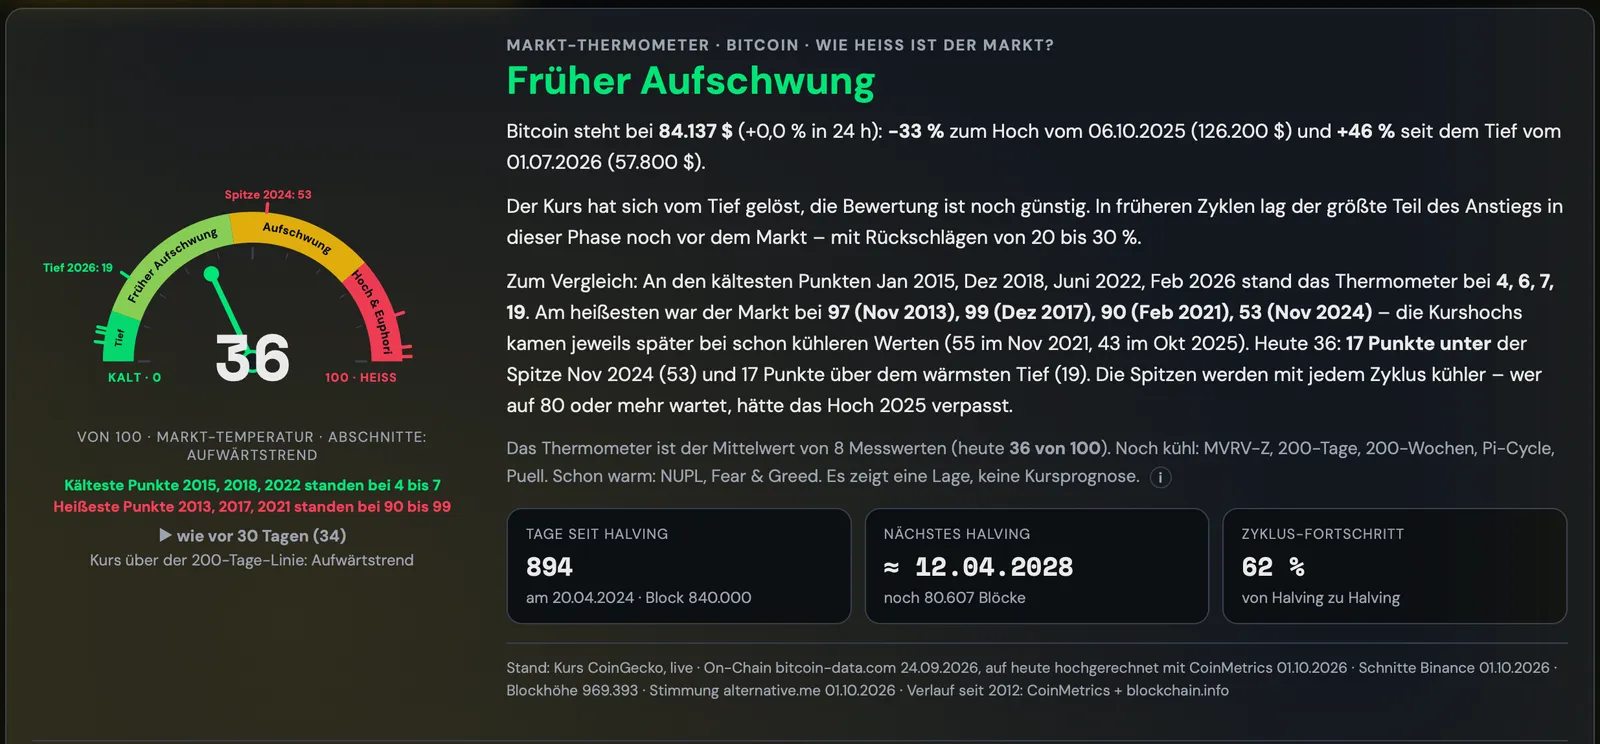
What you can do with it
The market thermometer
The thermometer is the average of eight metrics that signalled highs and lows in earlier cycles: MVRV-Z, unrealised profit (NUPL), price relative to the 200-day and the 200-week moving average, Pi Cycle Top, miner revenue (Puell Multiple), coins sold at a profit or loss (SOPR) and sentiment (Fear & Greed). Each metric sits on its own historical scale from bottom to top – with one sentence explaining what the figure means today.
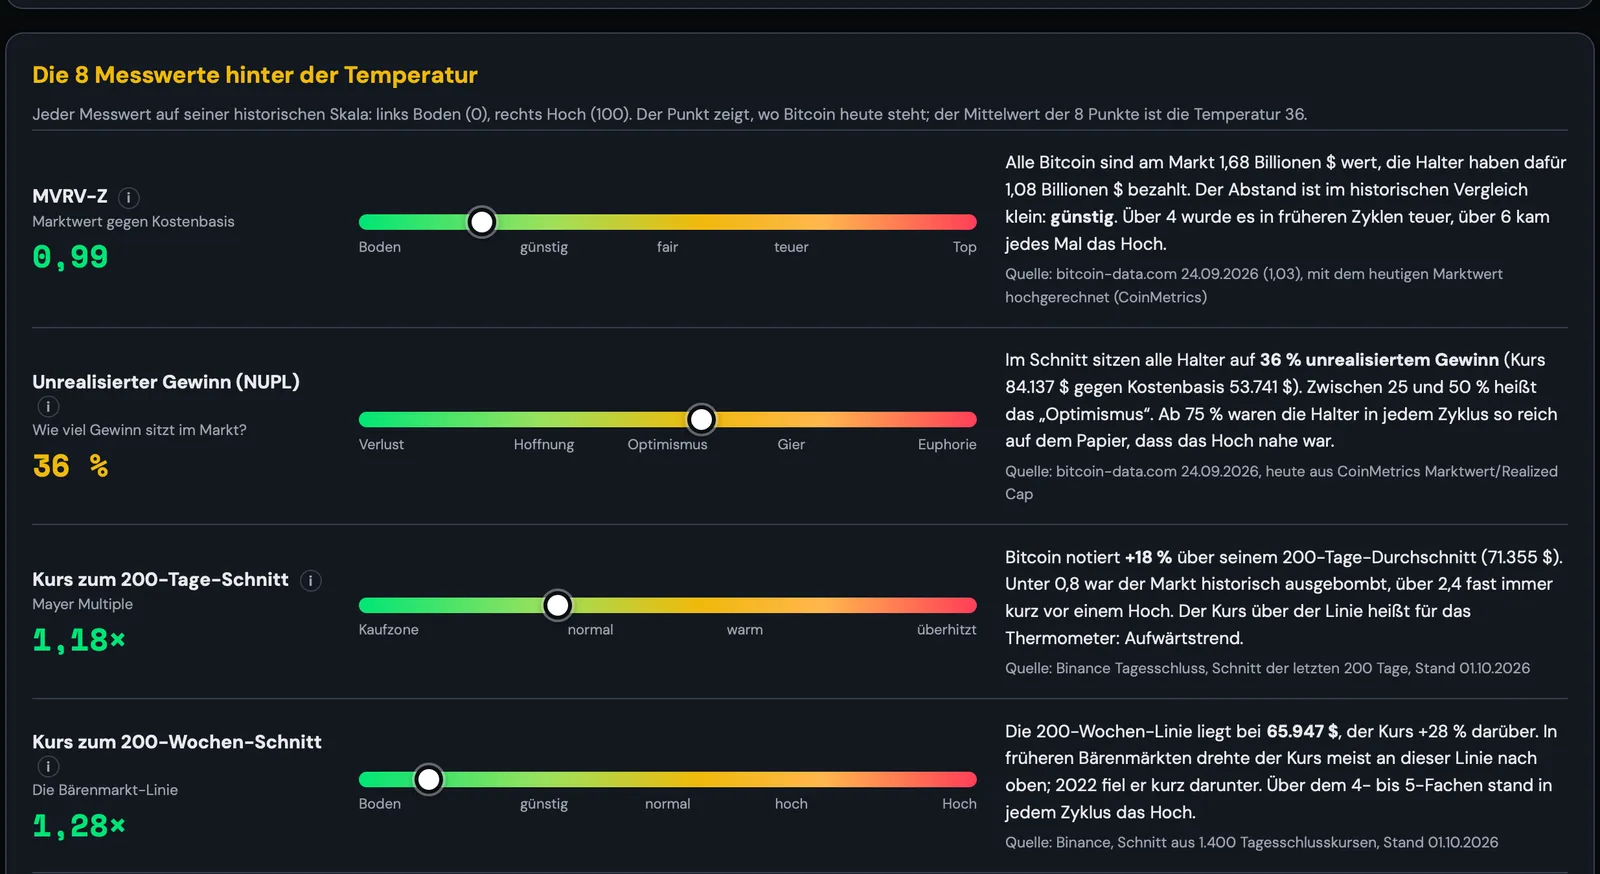
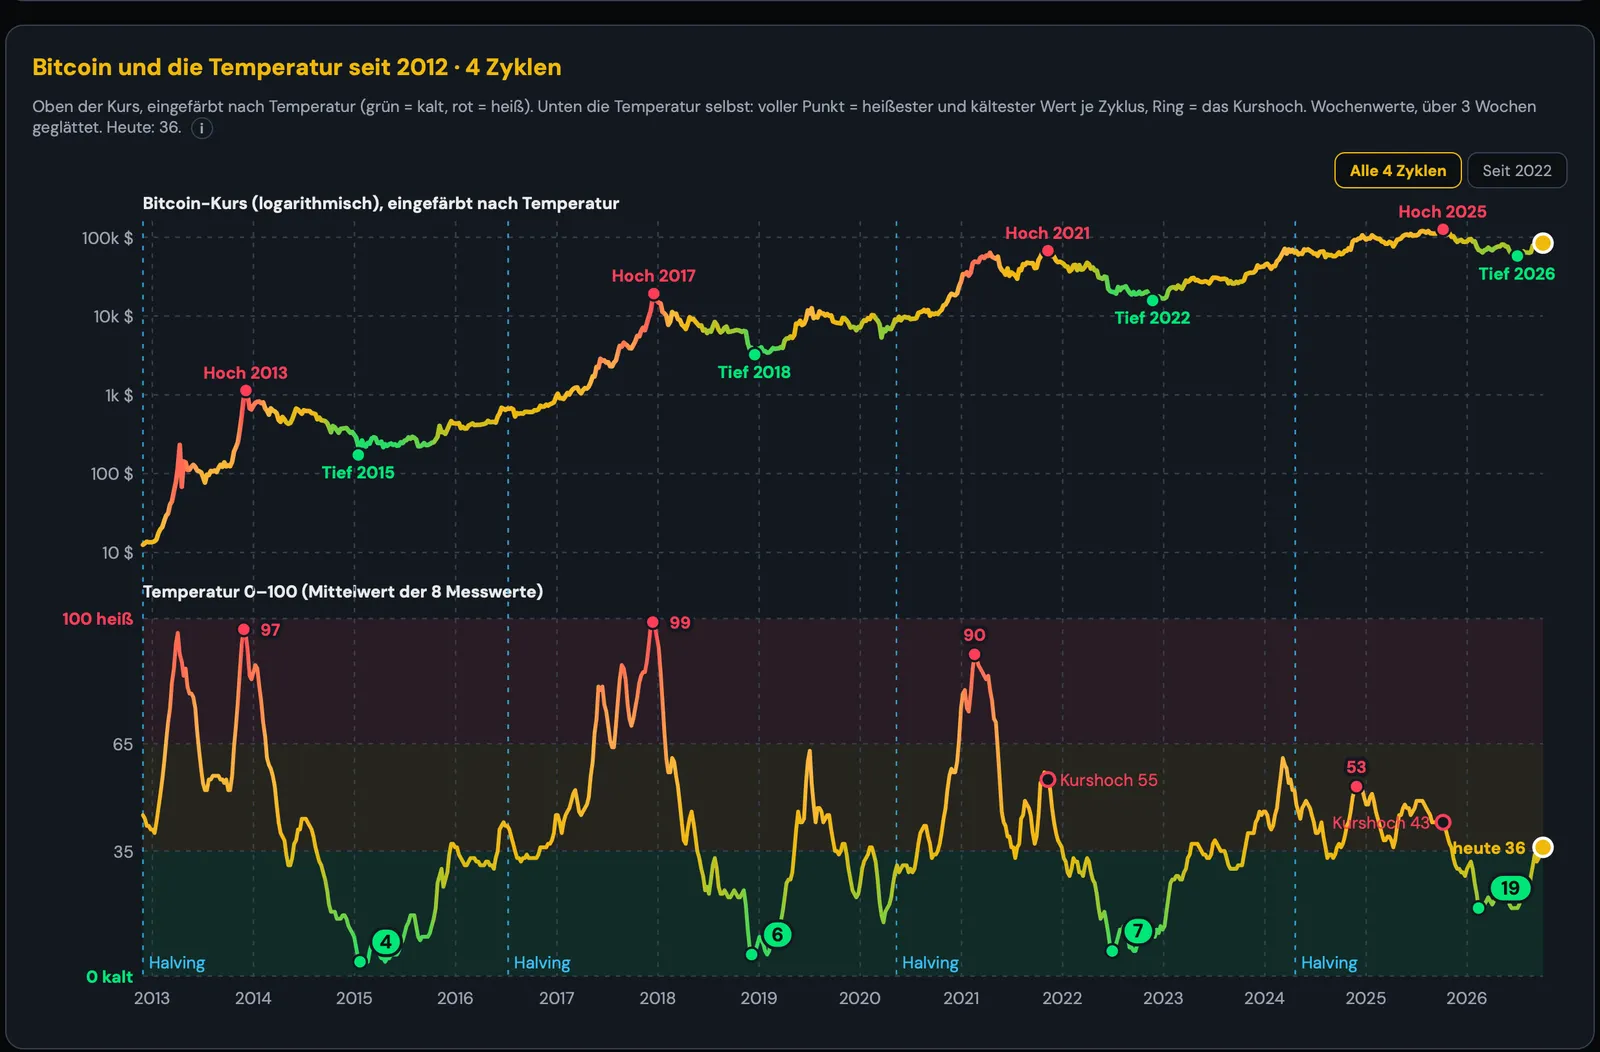
Four cycles compared
The history since 2012 shows price and temperature on top of each other. This lets you see how hot the market was at earlier highs and how cold at the lows – and that the peaks get cooler from cycle to cycle. A comparison from each halving shows where the current cycle stands relative to the three previous ones.
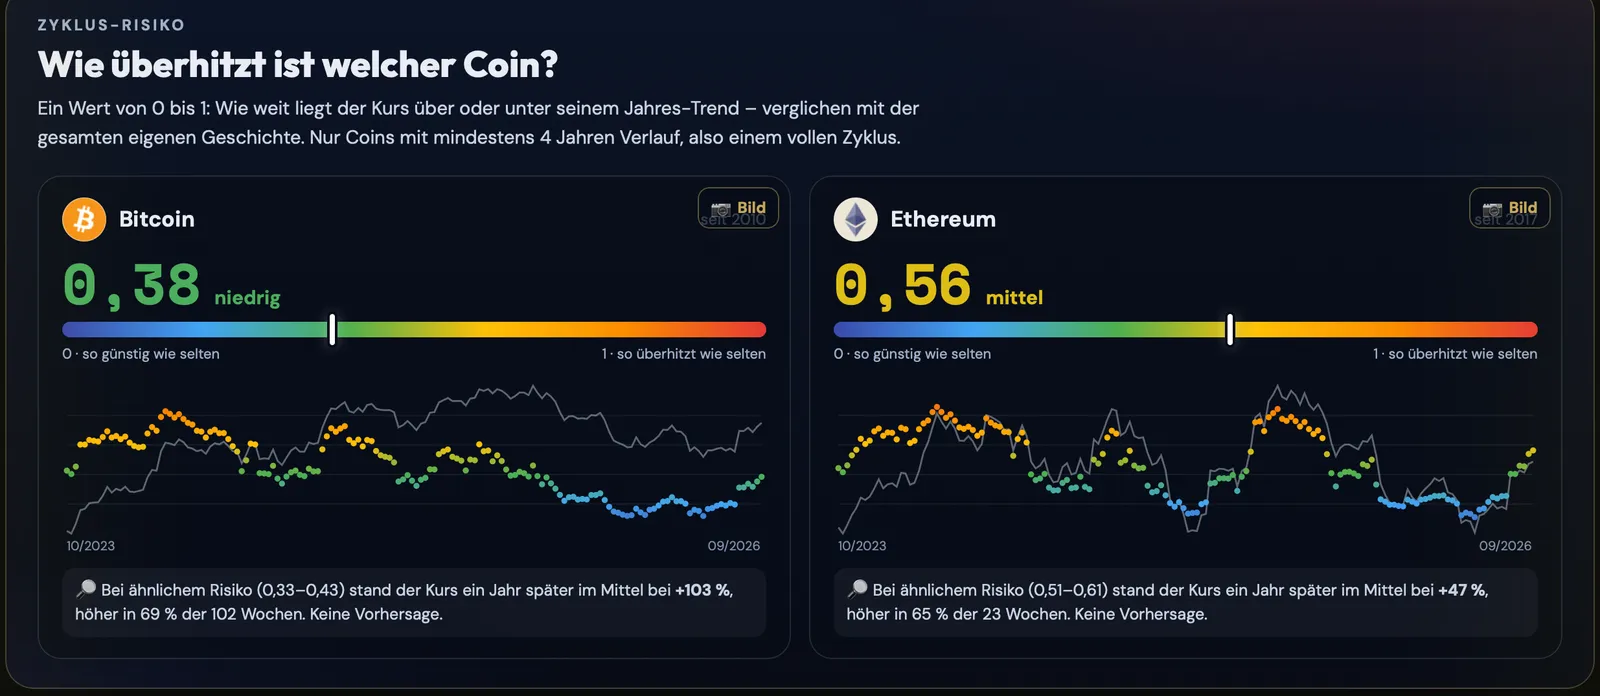
Price corridor and cycle risk
The price corridor places the Bitcoin price within a long-term valuation band (Rainbow and Power Law) and shows key levels such as the 200-week line or the Realized Price. Cycle risk applies the same idea to individual coins: for more than 120 coins with a full cycle, you can see how far the price today is above or below its own yearly trend – on a scale from 0 (rarely this cheap) to 1 (rarely this overheated).
How to get started
- Create an account and open “Cycle analysis” in the menu.
- Switch between thermometer, price corridor and cycle risk.
- Tap any figure – the explanation is shown right next to it.
Understand the cycle instead of guessing
The cycle analysis is included from the COMPASS plan upwards. Cancel monthly.
View plansFrequently asked questions
How can you tell where Bitcoin is in its cycle?
A single indicator is not enough. CryptoCompass therefore combines eight metrics – such as MVRV-Z, NUPL, Pi Cycle Top and Puell Multiple – into a single market temperature from 0 to 100 and compares it with the highs and lows of the cycles since 2012.
Can the thermometer predict the top?
No. It shows how hot the market is compared with the past. In earlier cycles, the highs often came only once the temperature was already falling again, and the peaks are getting cooler from cycle to cycle.
What is the price corridor?
A long-term valuation band for Bitcoin based on the Rainbow chart and the Power Law model. It shows whether the price is cheap or expensive relative to the long-term midline.
Is this also available for other coins?
Yes. The cycle risk shows, for more than 120 coins with at least four years of history, how overheated they are compared with their own history.
How up to date is the data?
The price is live; the on-chain values are updated daily. The source and date are shown below each view.
More features
The cycle dashboard shows the current situation, not a price forecast. The images show example values from 1 October 2026. Data sources: CoinGecko, CoinMetrics, bitcoin-data.com, Binance, alternative.me, blockchain.info. CryptoCompass is an educational tool by Die Kryptoschule (Mag. Klaus Baier, Höhnhart, Austria). Not investment advice. The images show a demo portfolio.